Customerlabs CDP Documentation
Events Manager
Events Manager offers a real-time, end-to-end visibility of the how the data was ingested into the system, how the data is processed as events and how the destinations receive the events.
In your CustomerLabs account, Navigate to Monitoring -> Events Manager.

Overview Section
The Overview section gives you an overview of the total count of events for the selected time range. You can choose your required time range using the Date Picker shown below.
Click “Refresh” to get the most up-to-date data.The “Last Refresh” time tells you when the data was last updated.

This also gives you a brief about the connected sources and connected domains and a button to configure an event instantly through the No-Code Event tracker setup.

Website
The Website displays the no.of domains linked to the account. On click of “n connected”, it enlists the domains linked and a field with “Save & Allow” button to link a domain instantly.
| Edit | The domain added can be modified. |
| Launch | The added domain can be launched in a new tab to ensure the |
| Delete | The added domain can be deleted. |
Sources
The Sources displays the no.of sources linked to the account. On click of “Manage Sources”, it enlists the sources connected and a button “Connect Source” to link additional sources.
No-Code Event Tracker
The No-Code Event Tracker enables you to track events for the connected domains. Click on the domain in which you wish to track the events.
Know more about No-Code Event Tracker.
Events Activity Section
The Events Activity Section offers a detailed summary of each event within the selected timeframe, including details on the latest received data, the total number of events processed, the data source, and the destination(s) where events are sent, either as server-side or client-side events.
Click “Refresh” to get the most up-to-date data. The “Last Refresh” time tells you when the data was last updated.

To sort data in a column, simply click on the column name. You have the option to sort in ascending, descending, or by last modified date.
Click on the “View” Action, to open the overview of a specific event.
(OR)
You can also click on the column data to open the overview of the specific event.
Events Overview
Events Overview gives a graphical view of the selected events processed for the selected time range. In addition to it, it also displays the event status (Active/Inactive) and a timestamp displaying the last received data as shown below.

Click “Refresh” to get the most up-to-date data. The “Last Refresh” time tells you when the data was last updated.
Additionally, the tabular view gives details about the selected event, including the total number of events processed from each source, the sources from which this events originated.
Click on the specific ‘Source’ to view Source Configuration and Click on ‘View Logs’ to view the JSON data processed. Alternatively, you can also select ‘Workflow’ from the dropdown as shown in the image above.
Server Side Destinations
- Server Side Destinations gives an overview of the selected event sent across different destinations as server-side events for a selected time range.
- This tabular overview details about the total number of selected event sent to the destination, success and failure percentage of events sent to destination.
- Click on the specific destination to view/modify the Destinations Configurations and Click on “View Logs” link to view the logs.
(Note: Click “Refresh” to get the most up-to-date data. The “Last Refresh” time tells you when the data was last updated.)

Client Side Destinations
- Client Side Destinations gives an overview of the selected event sent across different destinations as client-side events for a selected time range.
- This tabular overview details when the event was first synced in the destination and when it was last updated in the destination. It also displays the status whether it is active, inactive or subscribed.
- Click on the specific destination to view/modify the Destinations Configurations.
(Note: Click “Refresh” to get the most up-to-date data. The “Last Refresh” time tells you when the data was last updated.)

View Recent Events
View Recent Events details about the source the selected event originated from, the timestamp the event was processed, the event attributes and the log details for a selected time range.

(Note: Click “Refresh” to get the most up-to-date data. The “Last Refresh” time tells you when the data was last updated.)
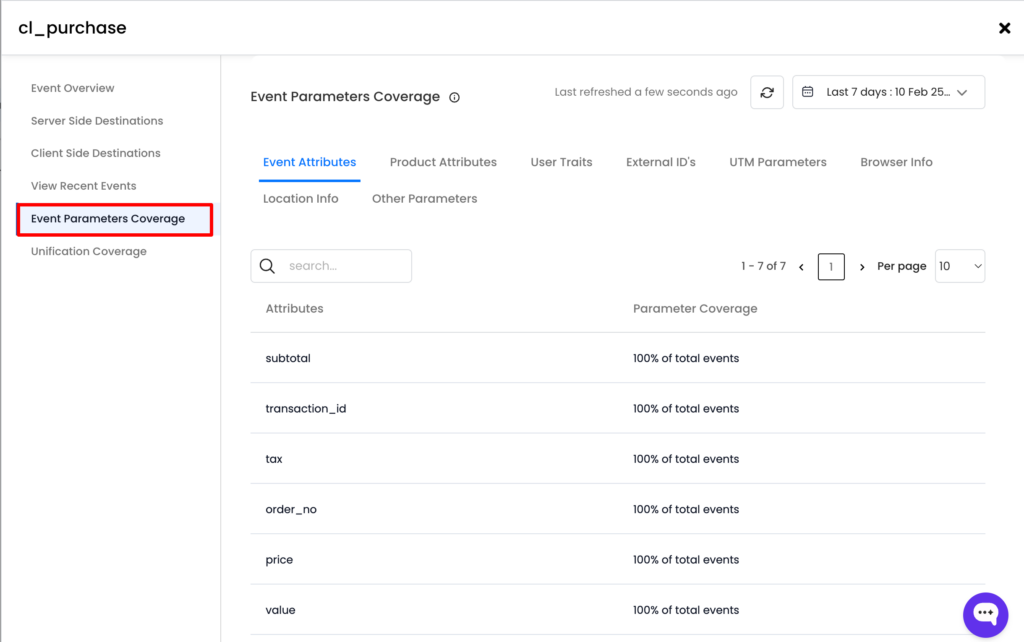
Event Parameters Coverage
Event Parameters Coverage gives a tabular view of the various parameters obtained via a particular event.
We have categorised the parameters as shown below,
You can click on each tab to view the parameters collected for a specific event.
(Note: Click “Refresh” to get the most up-to-date data. The “Last Refresh” time tells you when the data was last updated.)
Need assistance? Connect with our support team. We are happy to help!