Customerlabs CDP Documentation
Workflow Logs
The Workflow Logs offer a comprehensive overview of event configured by including the source data and its associated workflows.
This dashboard allows you to efficiently track the workflows and its transformed event using various filters, facilitating informed decision-making and troubleshooting when necessary.
Accessing Logs
You can access the destination logs by navigating to Monitoring → Logs →Workflow.
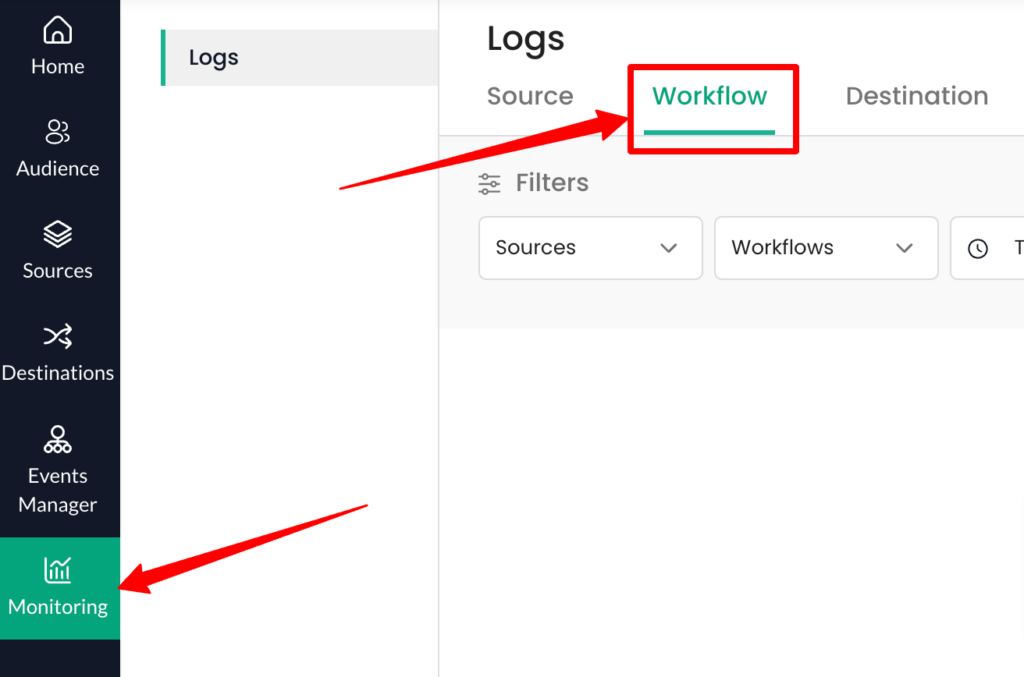
You can view the logs of the workflows configured via each source.
To view a particular workflow log, make sure the mandatory filter fields ‘Source’, ‘Workflows’ and ‘Time Range’ are filled.
After applying the filter settings and Clicking on ‘’Apply Filter”’, the relevant workflow logs will be displayed.
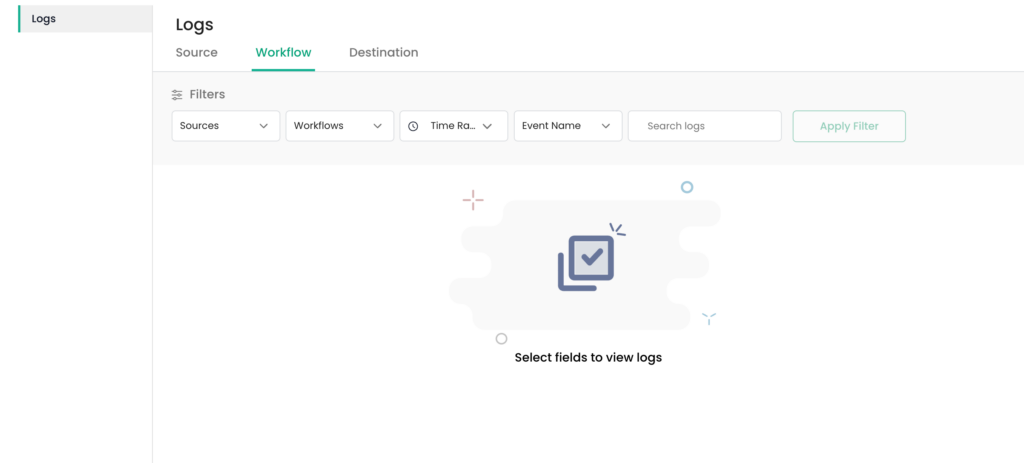
Filter Options
Source Filter
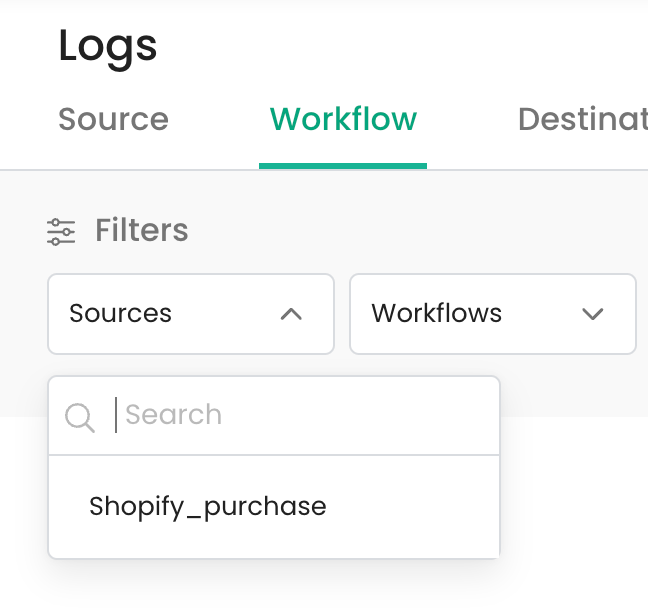
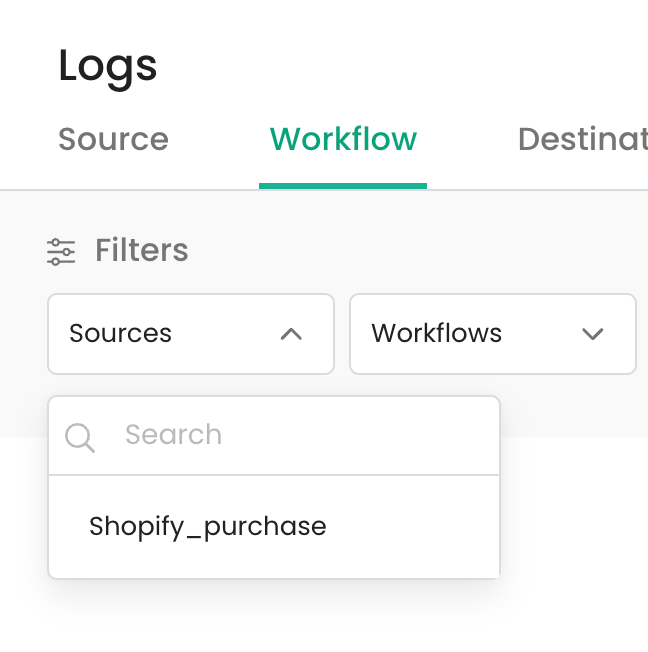
In the “Source” dropdown, all the connected sources will appear in the dropdown. Choose the specific source for which the workflow has been configured.
Workflow Filter
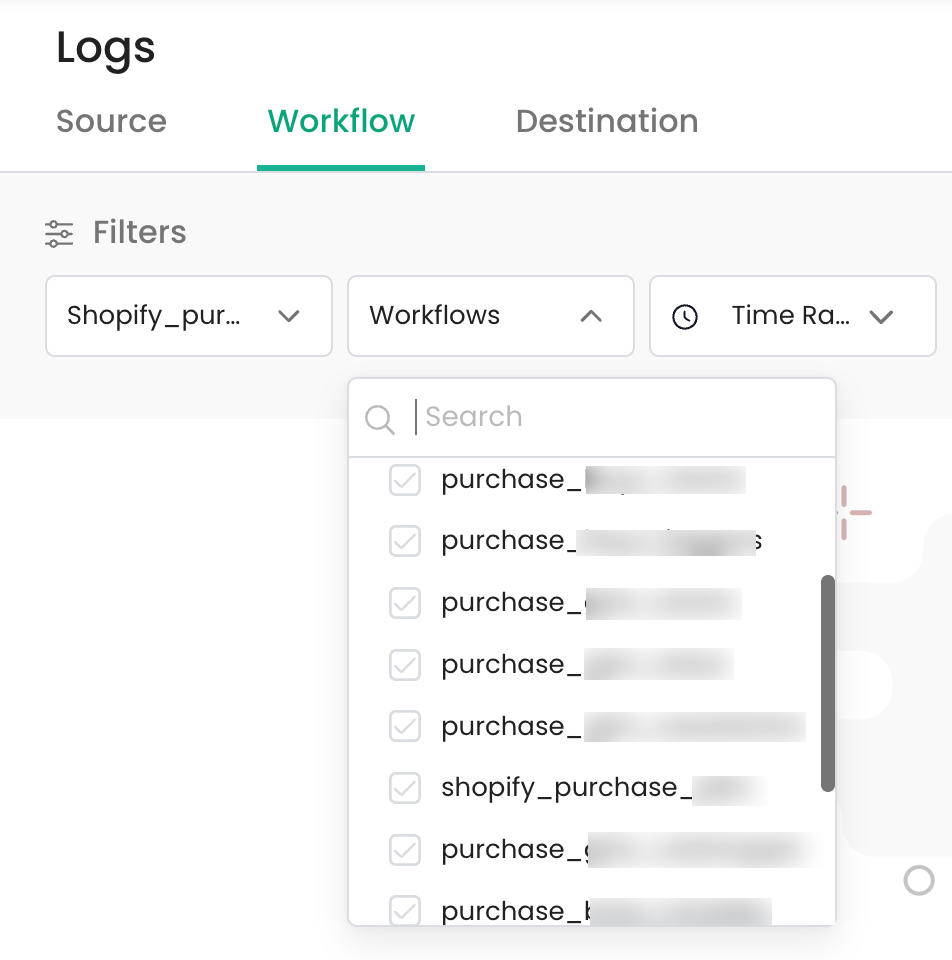
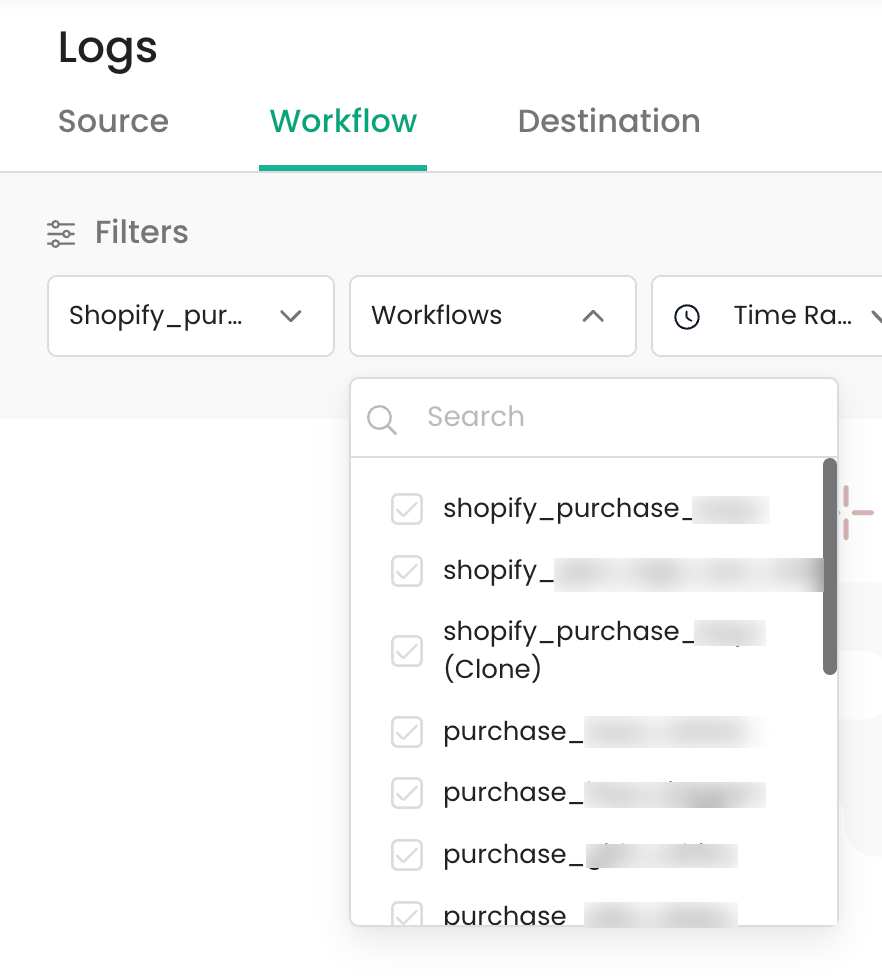
In the “Workflow” dropdown, workflows configured for that particular source will be displayed. Choose the specific workflow that you wish to view the logs.
Time Range Filter
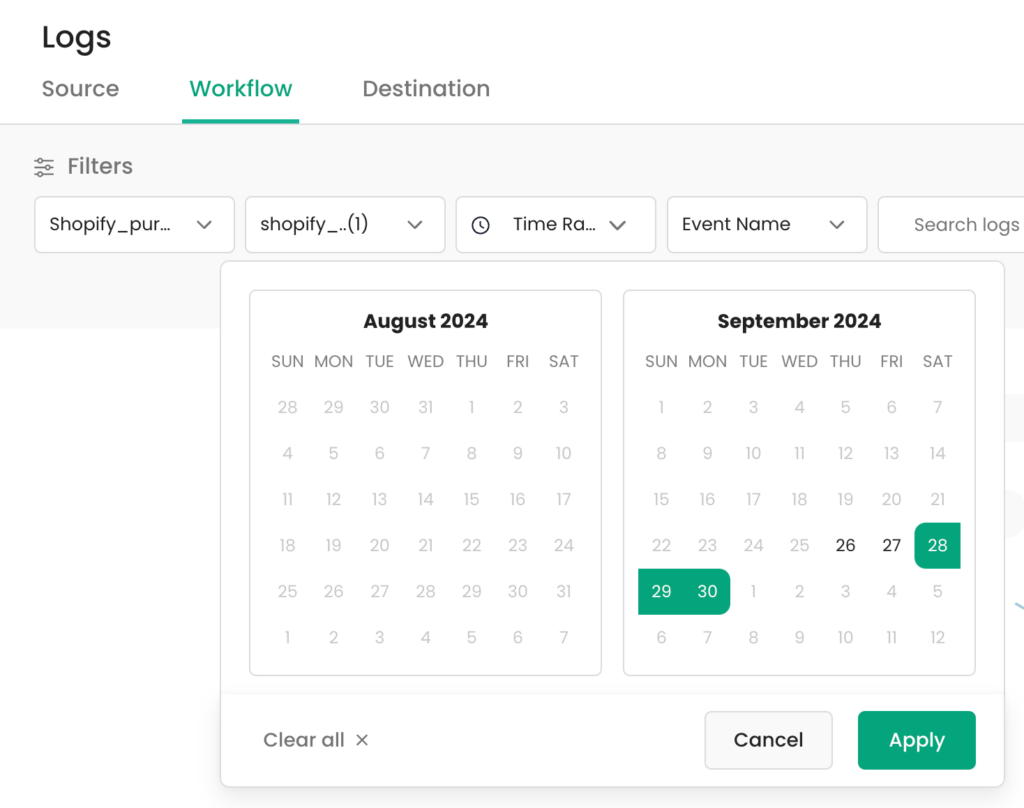
The Time Range filter lets you filter and view the logs for a selected time frame.
You can filter the data in relative timeframes given in the dropdown (such as last 5 minutes, last 4 hours, last 1 day.)
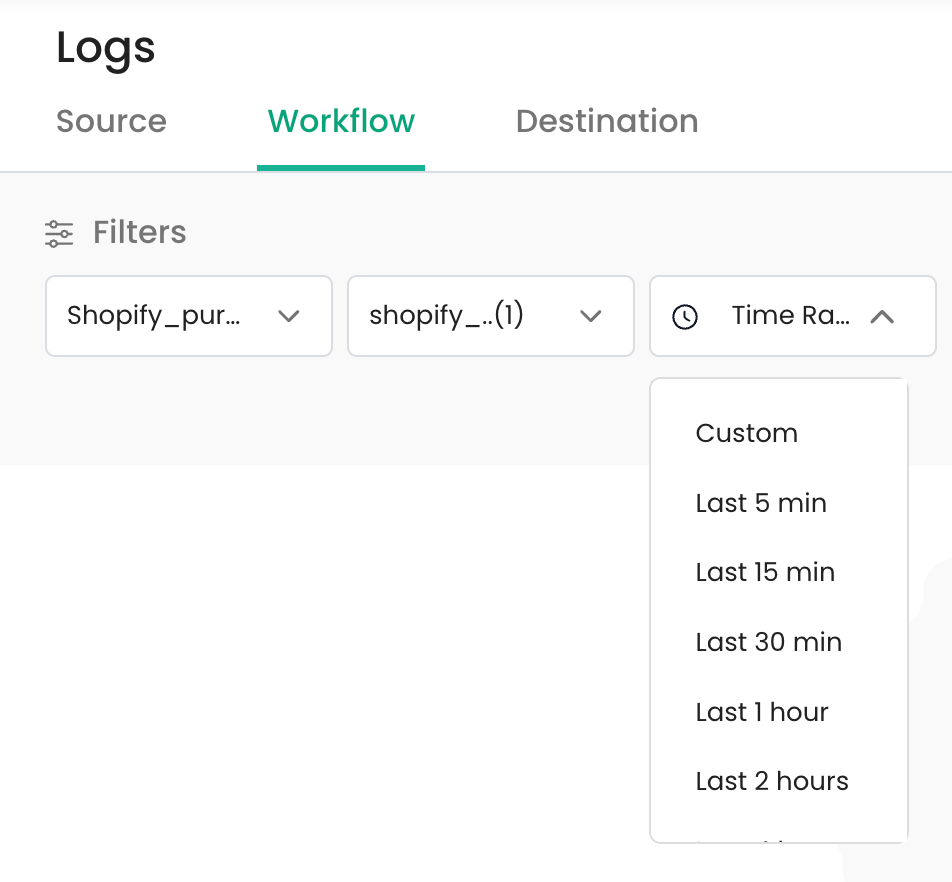
Also, a custom time and date range can be chosen to filter the log data.
Note: The custom range and relative times are applied in the “Processed At” time.
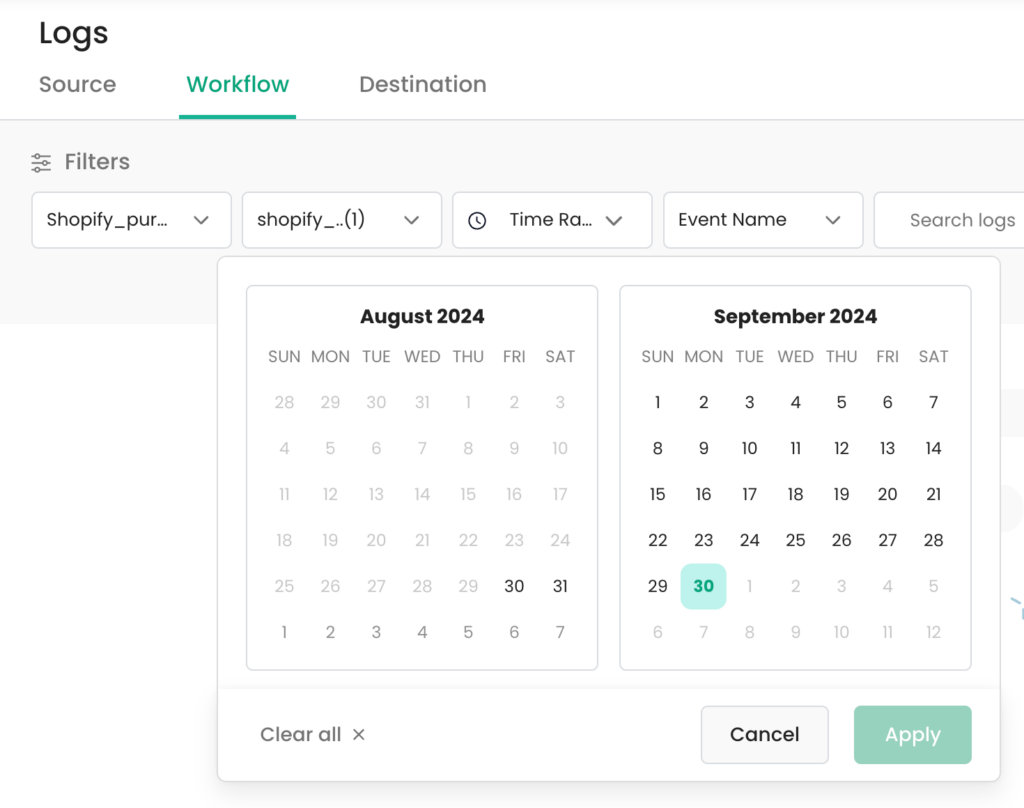
The logs are available only for the last 28 days, and the date can be chosen within this timeframe. However, within this range, log filtering is limited to any 3 consecutive days.
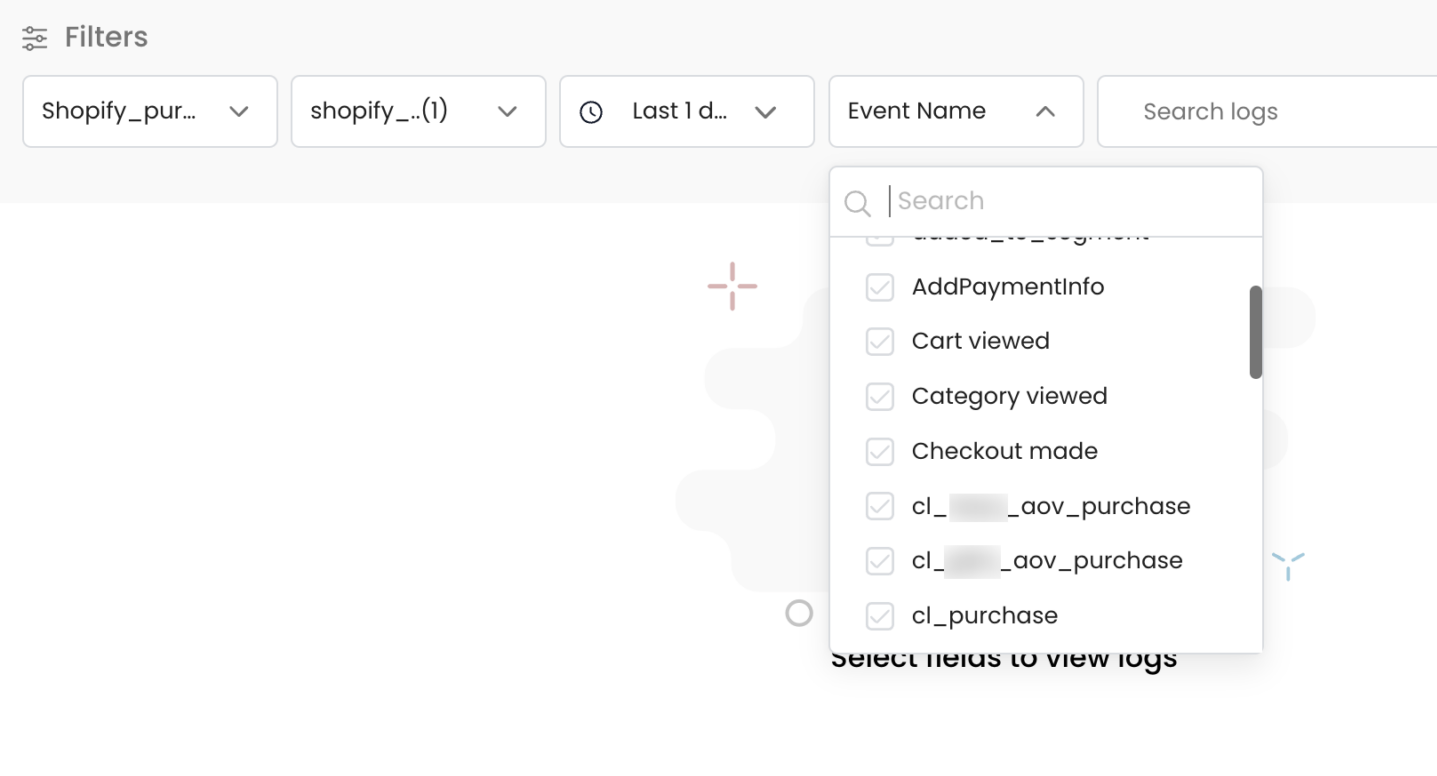
Event Name Filter
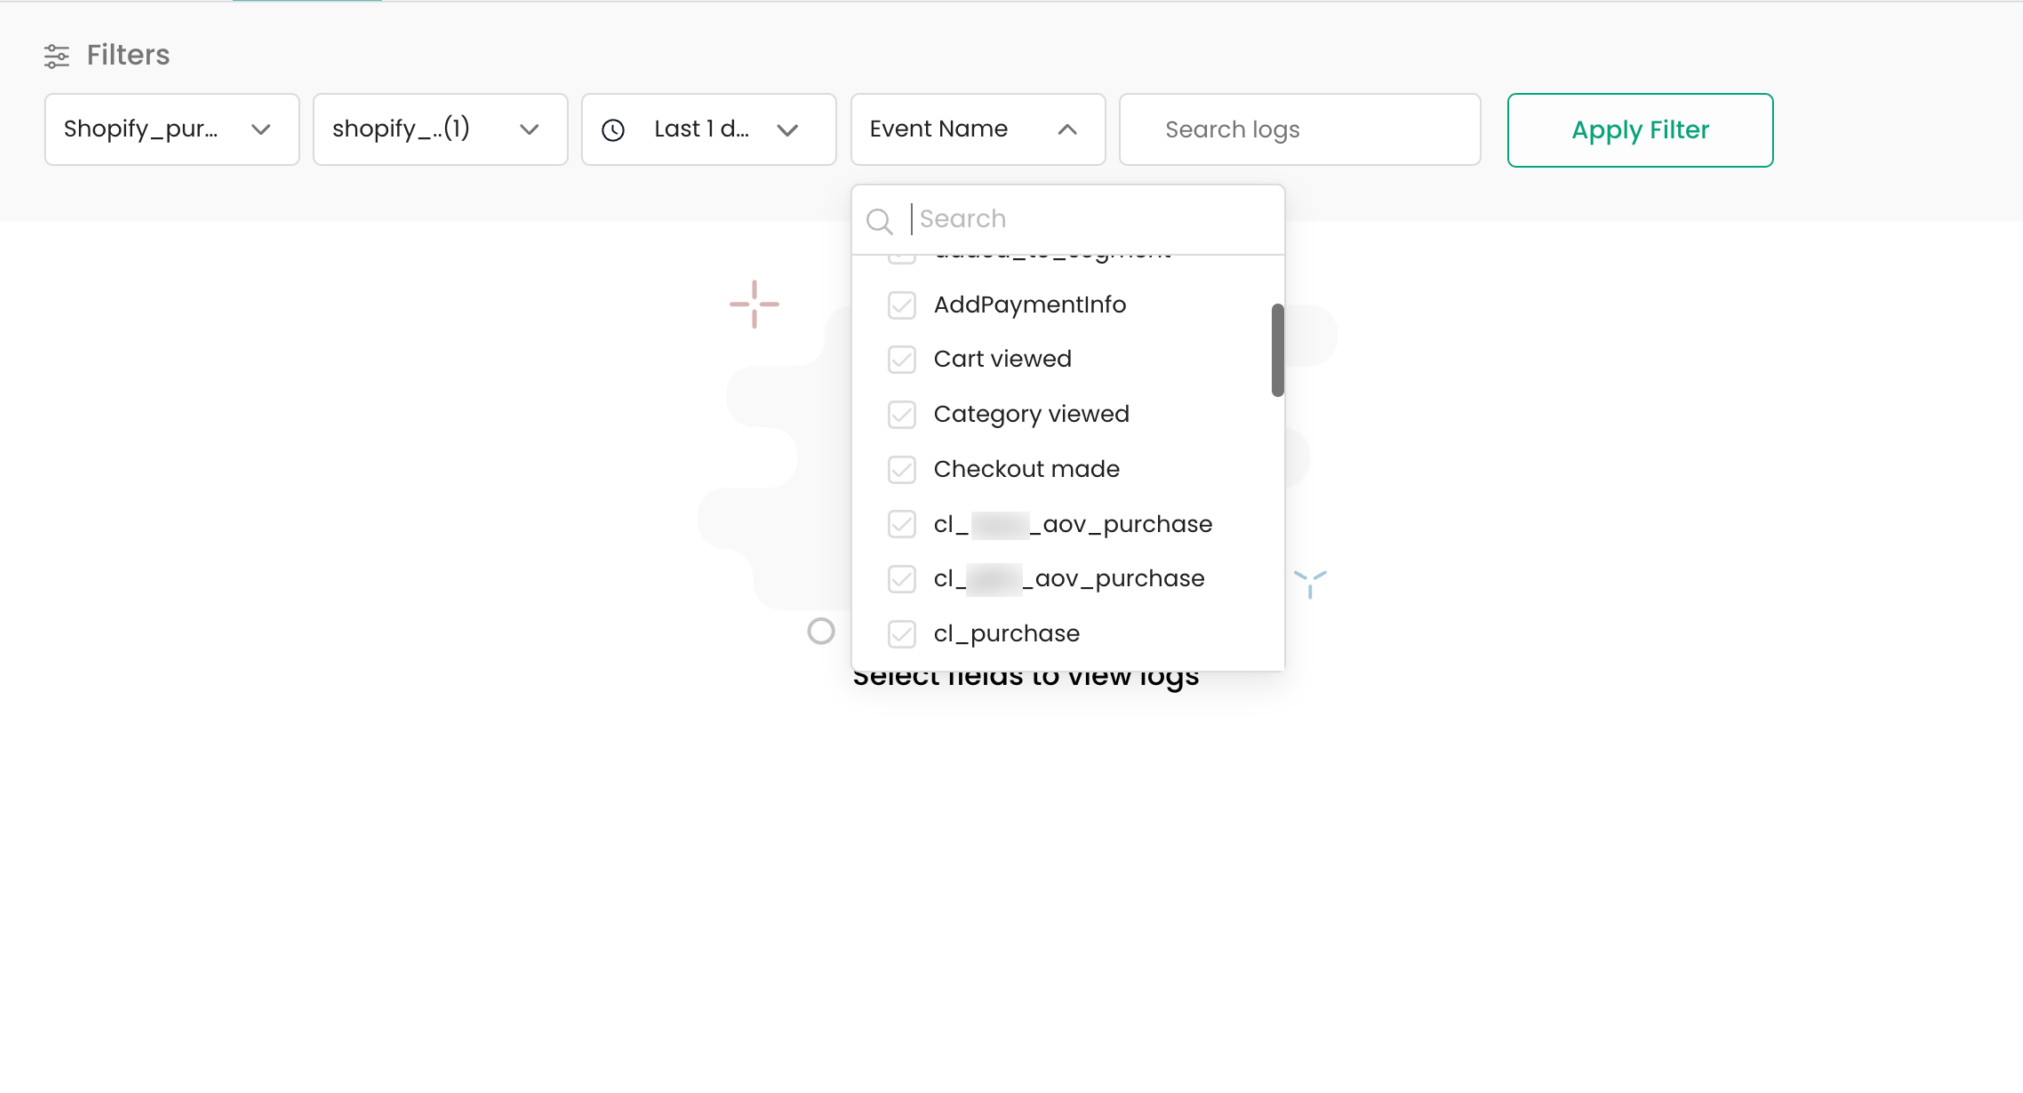
The Event Name input box allows you to filter the logs based on the transformed event. You can choose the transformed event name from the dropdown.
Search By Filter
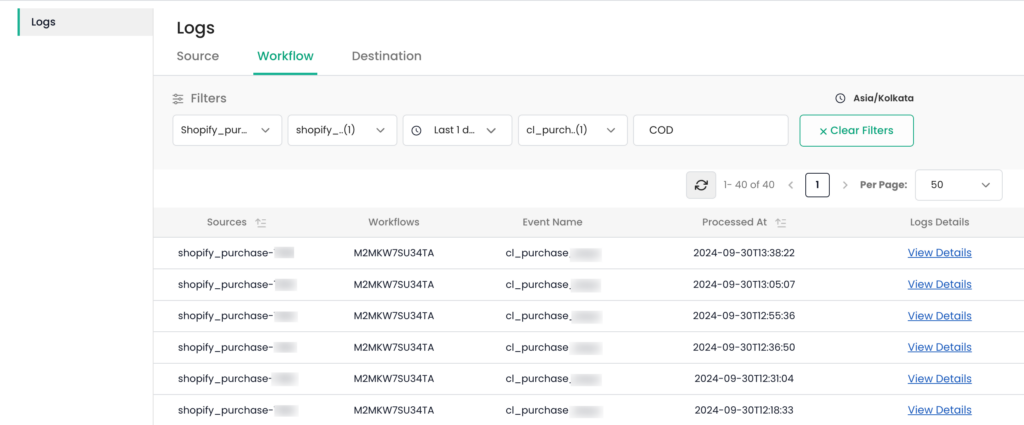
The Search By is an input box that allows you to filter the specific logs with any specific data and troubleshoot it.
Enter the text to be searched in the ‘Search Logs’ field.
For instance, You can filter the logs of customers who have made purchase using the ‘COD’ option.
- Input the text “COD” in the search text box. Click on “Apply Filters”

Viewing Logs
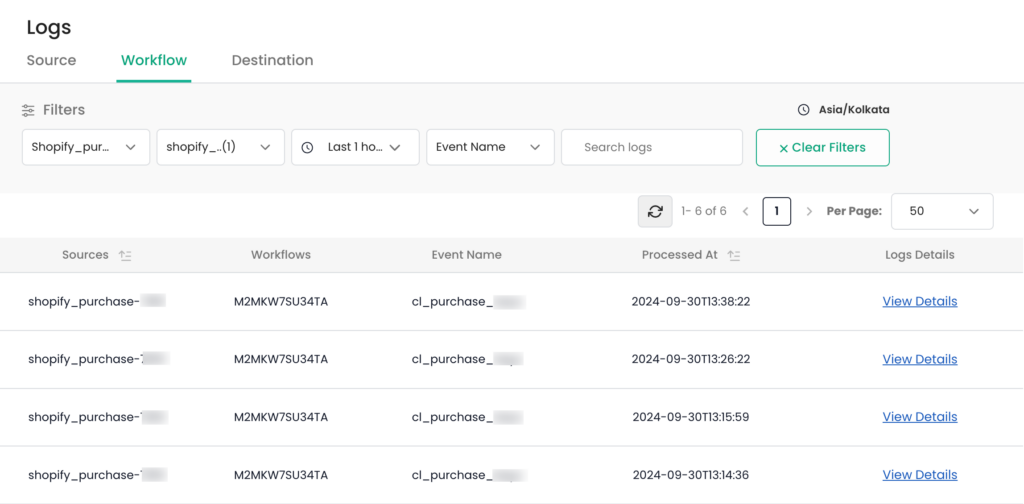
Once you apply the needed filters to view the logs, then hit the “Apply Filter” button to view logs.
Ensure that the mandatory fields, such as Source, Workflow and Time Range filter are chosen to enable “Apply Filter”

Log Details
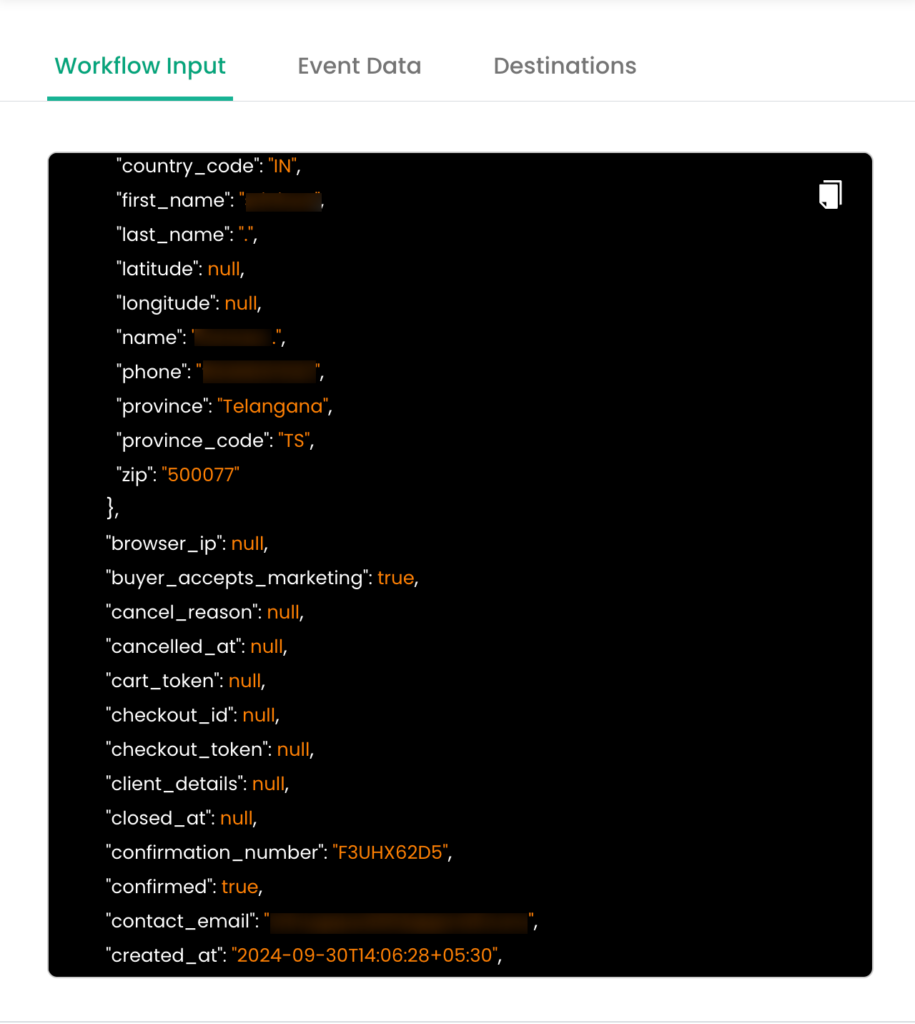
For viewing specific Log details, the “View Details” hyperlink button is provided that unveils a side panel presenting the JSON data.
The side panel has 3 tabs, Workflow Input, Event Data and Destinations in JSON format.
The Workflow Input will be the Source Data(incoming from a particular source).The Event Data presents the event configured by mapping User Identifiers, Event properties, Product details ,etc. The Destinations will provide the message ID to access the corresponding destination log.
Clear Filter
You can reset the applied filters by clicking on the “Clear Filters” icon. This action clears all the filters, returning them to their default state, and allowing you to apply new filters.

Refresh Logs
Click the refresh button to view the most recent data based on your filter settings.

Quick Example
Say, you want to check the logs of “cl_purchase event” who made purchase using “UPI” for the “last 3 days”.
Steps to find out this using Workflow Logs:
1. Select the source from the “Sources” dropdown.
2. Select the workflow from the “Workflows” dropdown
3. Select the time range as Last 3 days
4. Select “cl_purchase” from the “Event Name” dropdown.
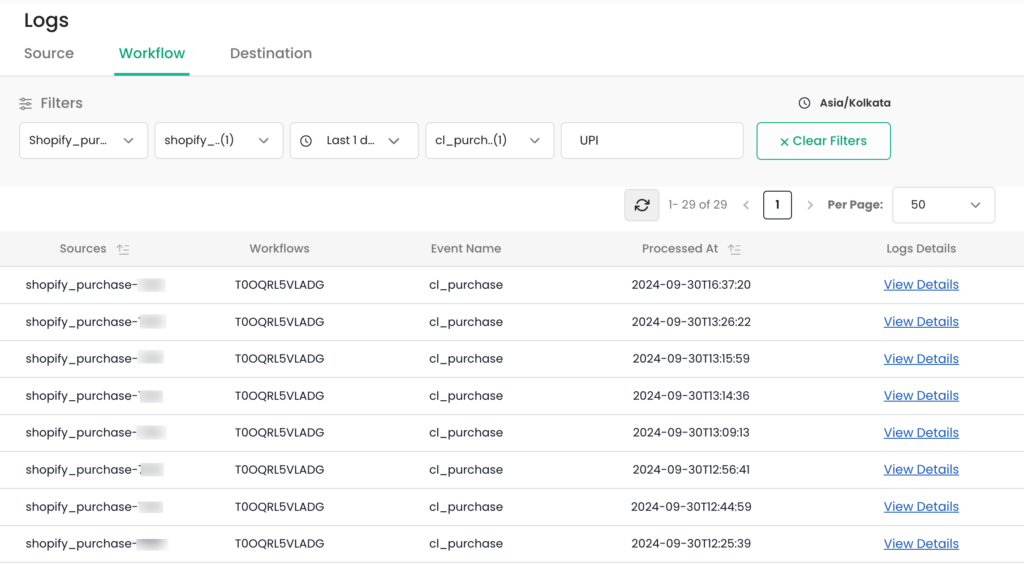
5. In the “Search by” field, Enter text “UPI”. Click on “Apply Filter” button to view the logs.

6. Click on “View details” hyperlink to view the details of the log.
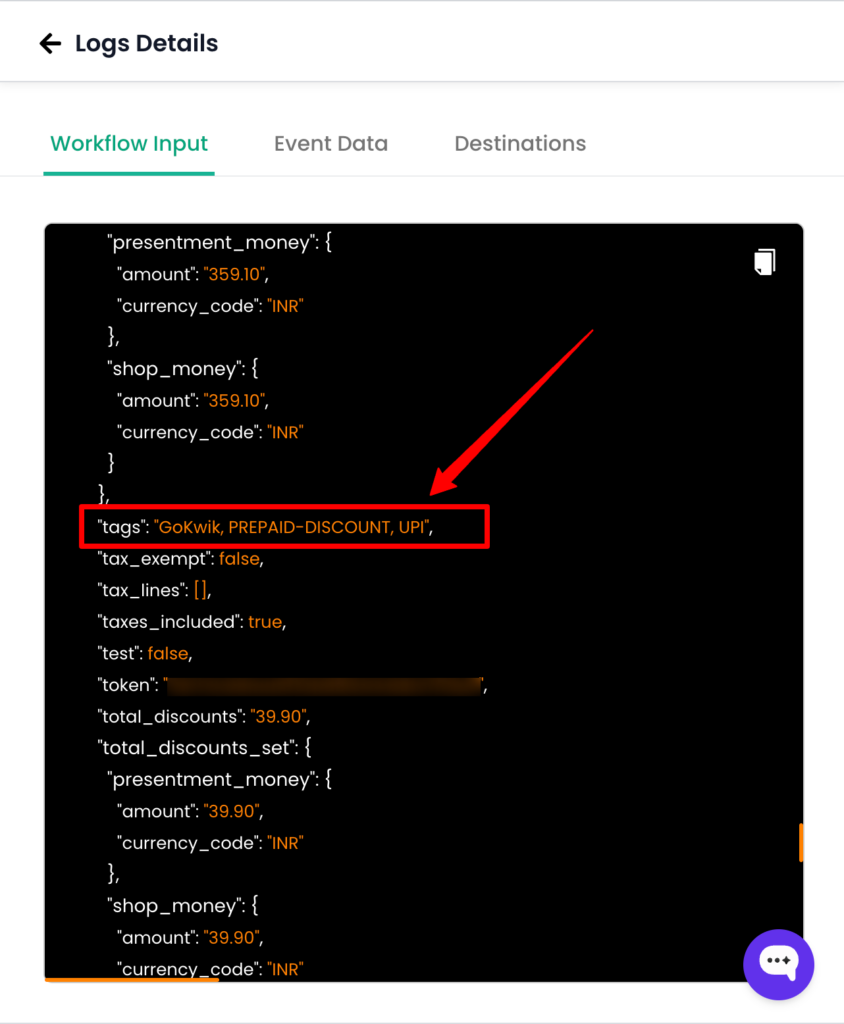
7. Now, in the “Workflow Input” tab, you can verify whether the tag “UPI” is available in the log.
Need Assistance? Please contact our support team [email protected]


